Much recent punditry has focused on the potential for women’s gains in the House. And with good reason: women have been winning Democratic House primaries at unprecedented rates.
But with Janet Mills now the official Democratic nominee for governor in Maine, the stars may also be aligning for women to head to governor’s mansions in large numbers. Given the diminished slate of Democratic female governors (there are only two nationwide), female Democrats may have the most to gain.
Women in the House Update
First, a brief update: with the results of recent primaries, women are finally expected to make gains in the next House of Representatives. I’ve migrated the full database and ratings to http://www.morewomeninthehouse.com/ where I’ll make continual updates until the general election.
The current projected gains are extremely modest (1/2 a seat, in expectation), though this number should rise as primaries continue. The expected number of Democratic Congresswomen is 65.85 (a gain of about five seats from the current 61), while the expected number of Republican Congresswomen is 18.65 (a loss of 4 or 5 seats from the current 23).
As I mentioned in my last post, one thing holding women back is the high number of female incumbents vacating their House seats. Fourteen of the 84 women currently serving in the House will not seek reelection.
While those retirements limit female gains in the House, they are also part of the gubernatorial story. Two Congresswomen have already won their party’s gubernatorial nomination, Kristi Noem (R-SD) and Michelle Lujan Grisham (D-NM), while two more are leading contenders in upcoming primaries: Colleen Hanabusa (D-HI) and Diane Black (R-TN).
Governorships are Different
When considering gender, governorships are different from representative positions in two notable ways: Democratic women do not outnumber Republican women, and women’s representation has declined in recent years.
Despite the fact that Republicans control both chambers of Congress, 73% of women in Congress are Democrats. Women comprise about a third of the Democratic caucus in the Senate (16 out of 49 Senators) and the House (61 out of 193 seats). But they only comprise about 10% of Republican Senators (6 out of 51 seats) and Republican House Reps (23 out of 235).*
The same pattern doesn’t hold for governorships, where Republicans hold twice as many offices as Democrats — and about 12% of each party’s governors are women. The four female Republican Governors are Kay Ivey of Alabama, Kim Reynolds of Iowa, Mary Fallin of Oklahoma, and Susanna Martinez of New Mexico. The two Democrats are Gina Raimondo of Rhode Island and Kate Brown of Oregon. This imbalance isn’t entirely a fluke of Democrats’ ebbing political fortunes. While many of the first female governors were Democrats, more Republican women than Democratic women have served as governors in the 21st century.
The more troubling reality is that women haven’t made consistent gubernatorial gains. The plot below shows women’s representation in both Congress and Governorships over the past century.**
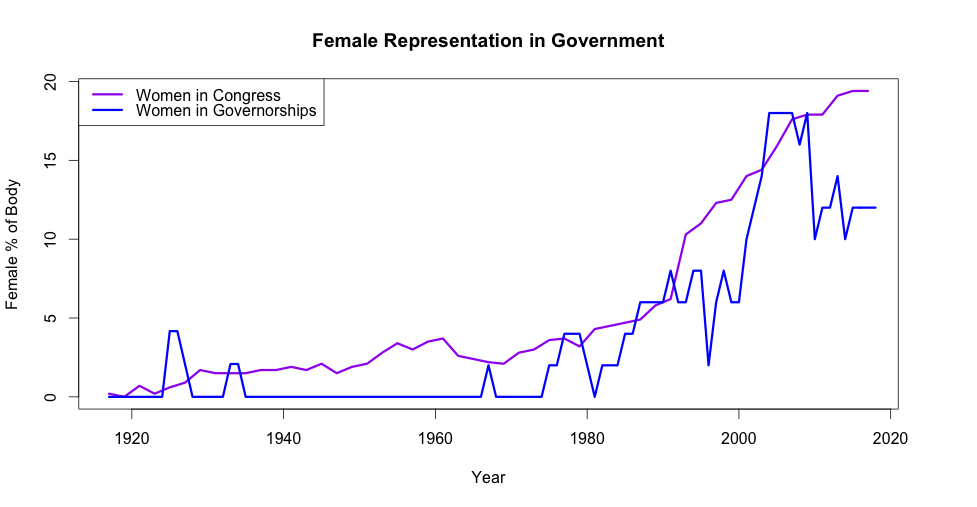
Female Congressional representation has tended to alternately rise and plateau since 1980. Governorships, by contrast, have fallen since a peak in the mid-2000s. At the start of Trump’s term, there were just four sitting female governors. A decade prior, there had been nine.
From a statistical perspective, this is partly a consequence of the fact that there are 10 times more Congressional seats than governorships. Hence, variation in the female proportion is likely to be larger even as women generally make gains. But there is also evidence that women tend to pursue legislative positions more frequently than executive ones, and are seen as more natural fits for the legislative role. So it’s plausible that, even smoothing out variation over time, women’s gains will be more muted.
The Current Roster
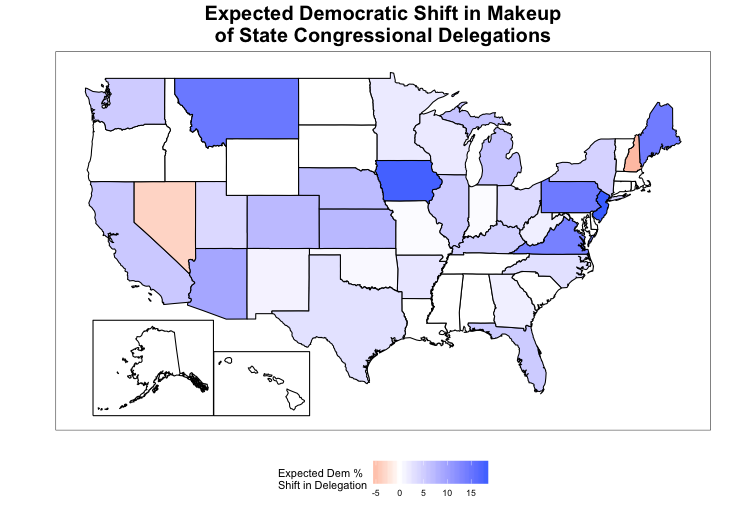
Based on the current slate of nominees, we’d expect the count of female Governors to remain roughly unchanged at six, but for the partisan composition to move toward the Democrats.
Raimondo, Ivey, and Brown are all seeking reelection and are favored to win (though Raimondo could conceivably lose the nomination to a primary challenger). Noem and Lujan Grisham are both the favorites in their open races. Reynolds and Mills are both Toss-Ups.
The three other current female nominees — Democrats Stacey Abrams (GA), Paulette Jordan (ID), and Lupe Valdez (TX) — are not considered competitive by Cook Political Report. But I’d keep on the lookout in Georgia: Abrams ran a smart primary campaign, has captured the imagination of the left, and may face a Republican damaged by scandal.
The full slate of current female nominees and ratings is given below.
| Name |
State |
Party |
Status |
Cook Race Rating |
| Kate Brown |
OR |
Democrat |
Incumbent |
Likely Democrat |
| Gina Raimondo |
RI |
Democrat |
Incumbent |
Likely Democrat |
| Michelle Lujan Grisham |
NM |
Democrat |
Open Seat, R-held |
Lean Democrat |
| Kim Reynolds |
IA |
Republican |
Incumbent |
Toss-Up |
| Kay Ivey |
AL |
Republican |
Incumbent |
Solid Republican |
| Stacey Abrams |
GA |
Democrat |
Open Seat, R-held |
Solid Republican |
| Kristi Noem |
SD |
Republican |
Open Seat, R-held |
Solid Republican |
| Lupe Valdez |
TX |
Democrat |
Incumbent Challenger |
Solid Republican |
| Janet Mills |
ME |
Democrat |
Open Seat, R-held |
Toss-Up |
| Paulette Jordan |
ID |
Democrat |
Open Seat, R-held |
Solid Republican |
Will the Stars Align?
The key to large female gains – particularly female Democratic gains – will be upcoming primaries. And unlike races for the House, women have not been dominating Democratic gubernatorial primaries. Competitive women have lost the Democratic nomination to male candidates in states including Iowa, Alabama, and Nevada. There is no clear signal that women will triumph in upcoming primaries either.
Among Democrats, Hanabusa is the likeliest to win the general election, but only if she successfully primaries incumbent Democratic governor David Ige. Some early polls showed her ahead, but polls appear to be tightening as the scandal over Ige’s botched handling of an erroneous missile alert fades. The smart money still appears to be on Hanabusa, but it’s no sure thing.
Former Senate Minority Leader Gretchen Whitmer in Michigan and former Florida Congresswoman Gwen Graham are also in competitive primaries for governor. Both find themselves in the unenviable position of the “establishment” candidate. Whitmer is probably likelier to prevail, though she is in a tight race with well-funded businessman Shri Thanedar (who has led some polls) and progressive favorite Abdul El-Sayed. Graham is running near the head of the pack in Florida, but most recent polls have shown Miami Beach mayor Philip Levine in the lead. If either Whitmer or Graham gets through the primary, she will face a Toss-Up race.
In Minnesota and Colorado, women are also competitive in Democratic primaries. The Minnesota race was thrown into chaos by the late entry of MN Attorney General Lori Swanson, who declared her candidacy only three weeks ago. State Representative Erin Murphy is also running, and won the endorsement of the DFL (Minnesota’s version of the Democratic party). Before Swanson entered, Congressman Tim Walz was considered the frontrunner, and there hasn’t been any subsequent polling. But I’d still bet on Walz to win the nod in the end, and advance to a Toss-Up race. Colorado State Treasurer Cary Kennedy is facing off with Congressman Jared Polis for the nod to succeed termed-out Democratic Governor John Hickenlooper. But Polis, among the wealthiest members of Congress, is spending heavily, and has led in the available polls. If Kennedy somehow triumphs, she’ll be favored to win in November, but I wouldn’t bet on it.
Democratic women are competing elsewhere, but appear highly unlikely to make it through both the primary and the general. Polling data indicates that female candidates are far behind in primaries in Wisconsin and Oklahoma. And while Cynthia Nixon’s challenge to Andrew Cuomo in New York may excite the base, she still isn’t drawing much support. Female candidates have good chances of winning the Democratic nods in Kansas, Vermont, Wyoming, and New Hampshire — but all these races are rated either Likely or Solid Republican by Cook Political Report.
Among Republicans, the field of potential nominees is much narrower. Black is the most significant contender, as she is leading most polls for the Tennessee Republican nomination, and would be heavily favored to win the general. Rhode Island House Minority Leader Patricia Morgan is also seeking the Republican nomination to take on Raimondo, although 2014 nominee Allan Fung is generally seen as the frontrunner.
Takeaways
The number of female-held governorships has declined since the mid-2000s, with the ranks of Democratic women particularly decimated. However, those trends may reverse in 2018.
Female Democrats are likely to expand the ranks of their governorships, with incumbents Kate Brown (OR) and Gina Raimondo (RI) likely to win reelection, and Michelle Lujan Grisham favored in New Mexico. Large numbers of Democratic women are competing in upcoming gubernatorial primaries. They have a good shot at winning the nomination in Hawaii, Michigan, and Florida as well as an outside shot in Colorado and Minnesota. Along with Maine nominee Janet Mills, this could yield up to six additional female Democratic nominees in competitive governor’s races in 2018.
Republican women are less likely to increase their count of governorships from the current four. Incumbent Kay Ivey (AL) is favored to win reelection, and current nominee Kristi Noem (SD) and probable nominee Diane Black (TN) will likely win as well. Incumbent Kim Reynolds (IA) is in a Toss-Up race, and few other Republican women are likely to receive nominations.
* There are currently seven vacant seats in the House, so these numbers add up to 428 instead of 435. I also do not count nonvoting delegates.
** To smooth the governor’s line, I show the maximum number of women who concurrently served as governor in any given year. The Congress line includes only the number of women elected at the start of each Congress, and ignores special elections. Data was sourced here.
 such that
  . If we define
  , then
  will trace out a path starting from
  such as the one below:
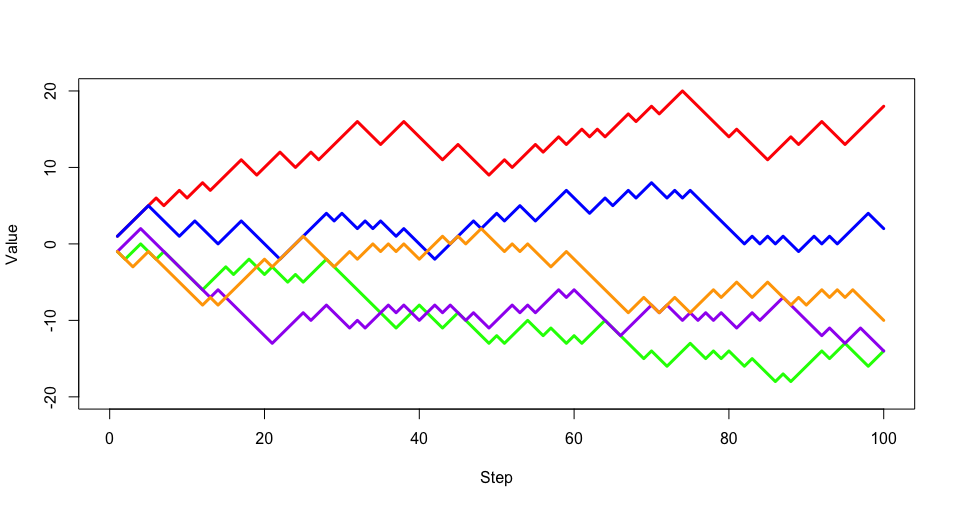
 as A’s final vote margin over B and
  as the total number of votes. Any ballot counting order in which A leads throughout can be represented as a path from
  which never touches 0 again. The path must go through
  , so we can equivalently state this quantity as the number of paths from
  , then the number of paths from
  to
to  that are 0 at some time is equal to the number of paths from
  to
to  to
to  is given by
  where
where  .
. . Some algebra shows us that:
 responses with
  votes tallied, and ultimately leads by
  to
to  that never hit
  . By the Reflection Principle, the number of paths from
  to
to 
 gives us the proportion of paths (and thus the probability of occurrence) in which the Democrat remains in the lead from
  and
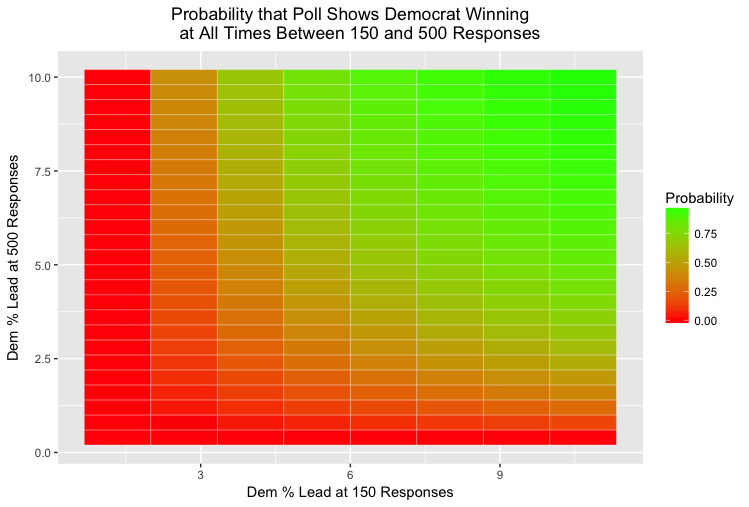
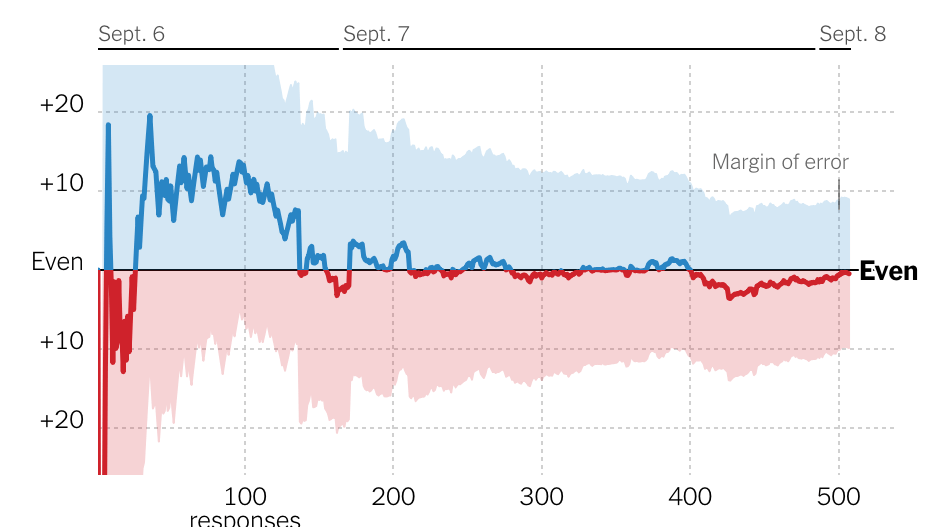
and  to see the effect on the NYT/Siena polls. Below, we plot the probability that the poll shows the Democrat consistently in the lead for a variety of potential values at 150 and 500 responses. Note that we’re only looking at positive values on both axes, since if the winner flipped between 150 and 500 responses, the result would obviously have to cross 0.